Code Maps In VS 2012
Code maps is another attractive visualization tool came with VS 2012 Update 1. it is more similar to the dependency graphs but this has more usability as this has been integrated with visual studio debugger so that the user can use this to visualize their debugging stack trace using this. We will see how we can use this.
Generate a Code Map :
Right click on the method which you want to evaluate & then click on “Show on code map”
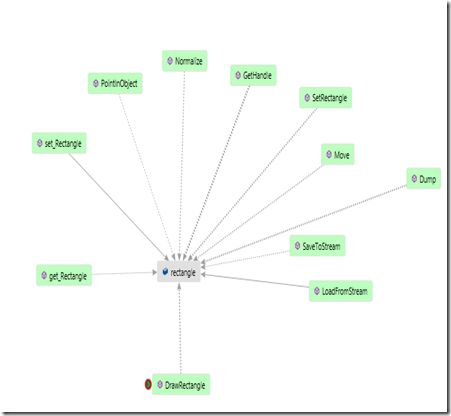
then it will generate a code map as below.
Adding Items to Code Map:
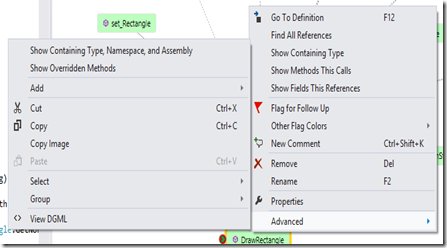
when you right click on the “DrawRectangle” in the surface you will get some options to add items to your map as you prefer.
- Show Fields this references :- Will show all the global fields or properties which this particular method is referencing. In the code sample which I am using this method using a global variable named rectangle.
2. Find All References :- suppose you have a bug in the DrawRectangle(). so you need to see what are the other methods which referencing this “rectangle” object. you can right click on that “rectangle” property & click on “Find All References”. it will show you all the methods referencing this variable.
There are some other options are also available as follows you can use it as per your requirement.
Feature: -
1. Legend
You can see the legend by going to the Code Map Toolbar:
2. Get details about a method
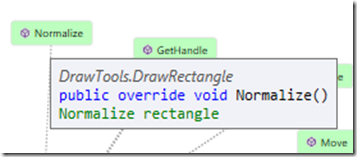
You can hover your mouse over any node to get more detail also you can double-click any node to see the code associated with it.
3. Flags
You can also flag nodes using a variety of colors to indicate some type of action needs to be taken.
3. Comments
Also you can add comments to your code map if you want to note something when you analyzing the code for you or your team members future reference.
3. Sharing
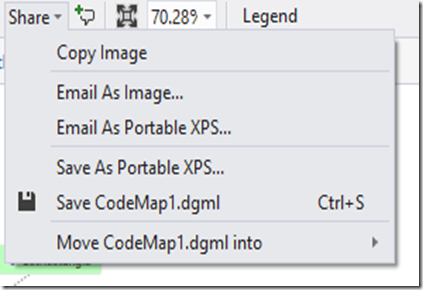
You can share the code map you have created. There are several sharing options available for you in the code map tool bar.
You can find a video on code maps here.
We will discuss how to attach the debugger with the code maps in my next post. Until that…
Happy Visualizing !!!!!!


Comments
Post a Comment